Visualizer
Tables and Charts Manager
Create responsive, fully-customizable tables and charts, edit them directly on your posts with our excel-like editor, or import the data from your database.
A Few Reasons Why You’ll Love Visualizer
Variety of data sources
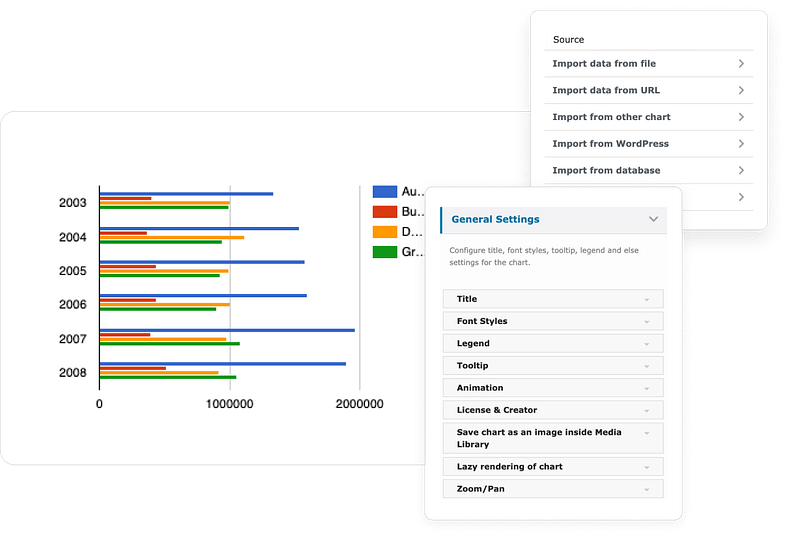
Add your data manually, from remote URLs, query your database, or use an external API.
Dozens of customizations
Display your data using 15 chart types, each with dedicated customization options.
Display anywhere
Show your chart in posts, pages, or your favorite page builder.
15 Chart Types Available
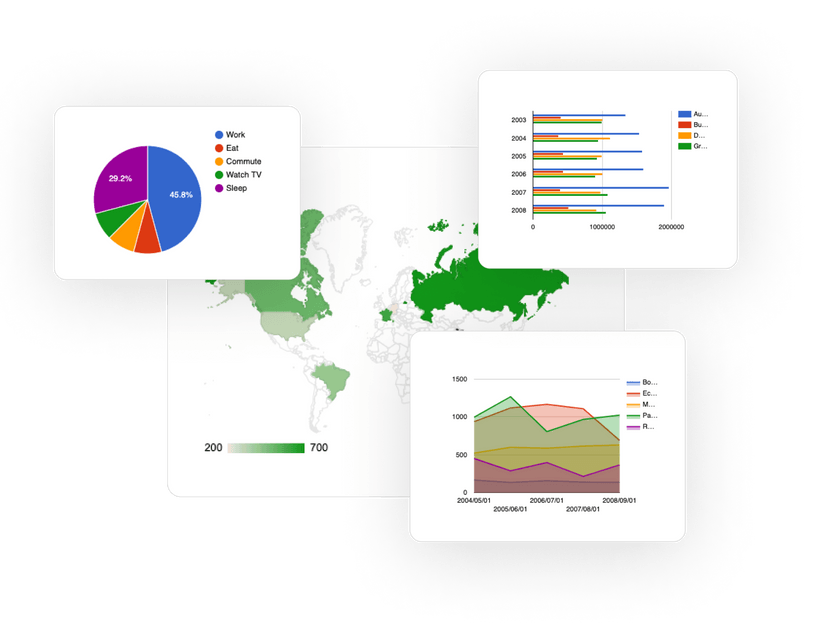
Visualizer offers a variety of options for displaying your data, including the DataTables table, 12 charts from google charts, and 6 charts from Charts.js.
Visualizer allows you to select from various chart types and presents data in a visually appealing and easy to understand manner
Innovative Charts for the new WordPress era
Line Chart
You can display a series of data points connected with line segments using the line chart.
Area chart
You can display visually quantitative data using the area chart.
Pie Chart
You can render numerical proportions and divide them into slices using the pie chart.
Table Chart
You can organize your data using the table chart type.
Column Chart
You can use a column chart to show comparisons among different categories.
Gauge Chart
You can build a simple gauge with a dial using this chart.
HOW VISUALIZER CAN HELP YOU
Discover New Ways to Enhance Your Site
- 15 chart types
- Data synchronization
- Private charts
- Responsive charts
- Excel-like editor
- External APIs support
- Database support
- Performance
Bring More Functionality to Your WordPress Site
Synchronize your data automatically
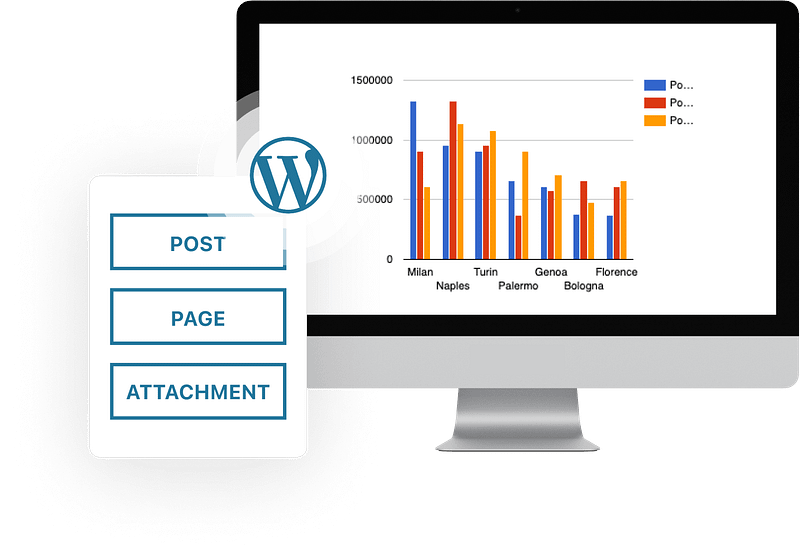
Create schedules to synchronize your charts with your online files (CSV, Google Sheets), databases, or external APIs. Additionally, you can create charts based on information about your WordPress installation, such as the number of posts, pages, or attachments you have. This could be done for your own knowledge or if you’d like to publicize these to your users.
Interactive Charts
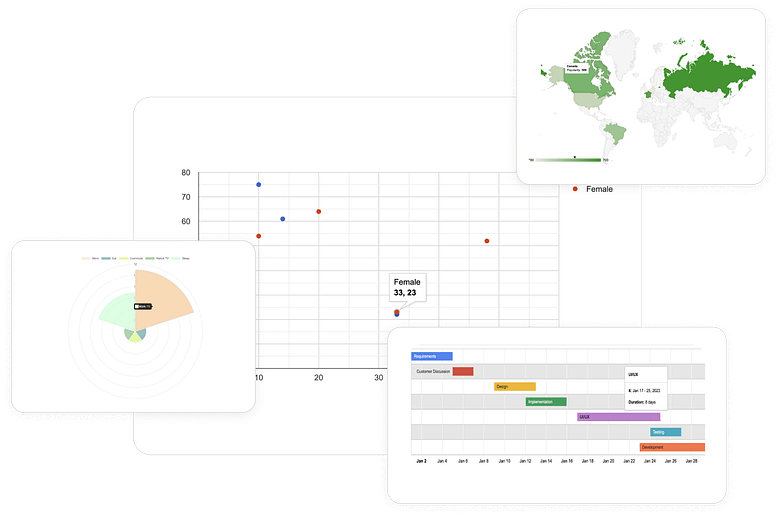
Interactive charts offer a dynamic and engaging way to present data. The following are key benefits:
- Interactive presentation of data
- Customizable appearance options (colors, designs, behaviors)
- Improved communication of data
- Increased accessibility and understanding of data.
Customize permissions
of charts
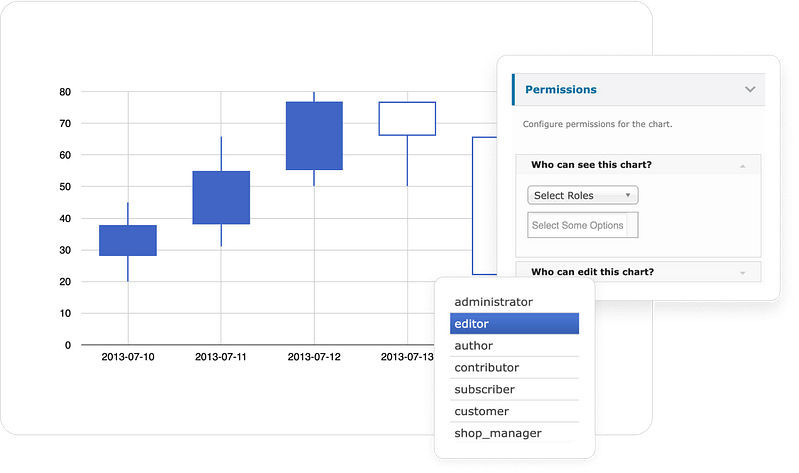
The Permission feature in interactive charts provides control over who can view or edit the charts. The following are key benefits:
- Control over who can view or edit charts
- Option to allow certain editors to modify charts
- Option to allow anyone (including visitors) to modify data on-page.
Advanced Tables, Instantly
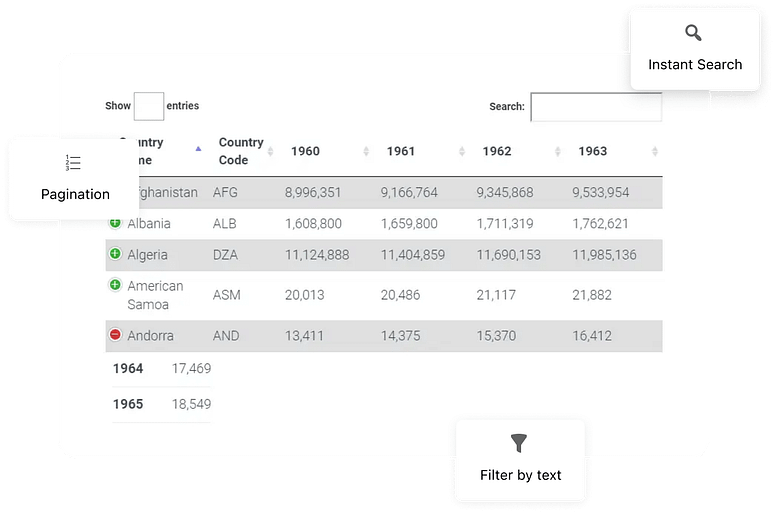
Add advanced interaction controls to your HTML tables: pagination, instant search, filter results by text search, multi-column ordering, and many more features!




Reviews
Clear filtersThere are no reviews yet.